Search

STOCKREVERSALS.COM : Advisors with a Contrarian Bent: Opt In Free for E-mailed Market Forecast Reports, Swing Trade Ideas, & Research

Month

July 2016

Weekly Forecast Report- Ballistic Moves Ahead?

If you have not looked into our SRP Swing Trading and Forecast service, perhaps now is a good time. We not only offer great market beating swing trades with daily guidance, SMS Text, and Morning updates , entry and exit advice… but some of the best market forecasting available on a daily basis. Read up at www.stockreversalspremium.com 
If you are not ready to make the leap, opt in for our intra-week ideas and forecasts which are E-mailed for free to opted in SR members. Name and Email sign up here. 
Dave,
Thanks for the great first week and a half.  My acct. is up 150% playing options on 3 of your picks.  Your burning match theory is right on. Thanks, Mark- SRP Member 7/30/16
I couldn’t be happier with your services and professionalism. I’m blown away by your response time and even more so, how simple and easy you made this process. I continue to only speak the highest of SRP. You’re great. Thanks again, Dave. Take care, Steven- SRP Member 7/29/16

Ballistic Moves ahead in Gold?  SP 500 on verge of another move?  Read on…

SRP projected all time highs back on May 9th and kept with the forecast. We modified targets to 2176 on July 4th as major resistance and that so far as been the case:

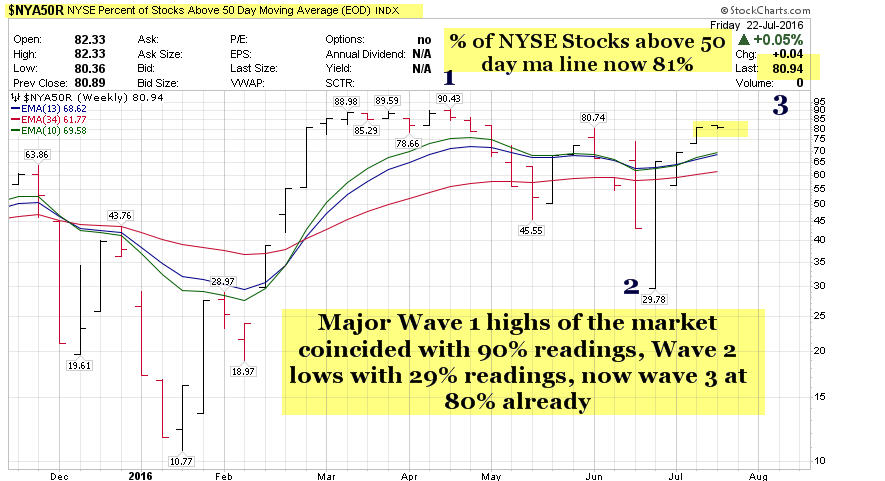
The SP 500 has marked 12 trading days of consolidation as part of Major wave 3 of Primary 5 from the 1991 lows of Major 2.  We are in the middle of Primary Wave 5 up in the Bull market which is the final leg of the journey from 666 lows back in March 2009.  Below is both our Long Term  updated views and the intermediate views.  We see 2191 and 2245 as our bogeys ahead. Normally on Day 13 we get a shift, in this case we expect it to  be upwards to new highs. 2138 remains key support on the downside.

731 srp lt SP 500731 srp sp 500

There are a few caveats to pay attention to in terms of the rally.

1. The Bulls in surveys are now 53% vs. only 21% for Bears (Investment Advisors)  This is typical during a bullish wave and keeping in mind we are in a “3rd of a 3rd” pattern which tends to be the most bullish in terms of optimism and movement.

731 bullsvbears

2. VIX Volatility levels trading near Bull Cycle lows here under 12.  This though again would be typical during a 3rd of a 3rd pattern up from the 1991 Major 2 lows:

731 srp vix

3. Fear and Greed index running hot, but again typical of 3rd wave of of 3rd wave

731 fear and greed

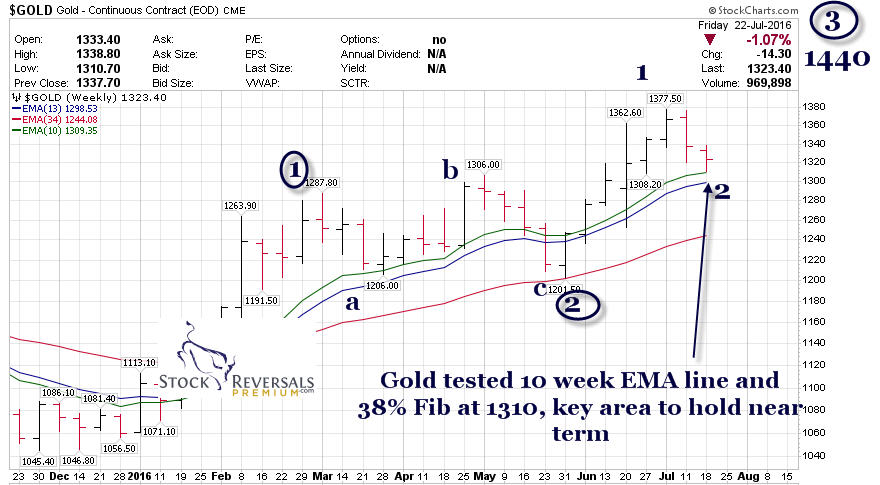
Gold about to go Ballistic?

With the above in mind, we continue to expect further all time highs ahead.  We turn our attention to another Bull Cycle which is Gold.  Back on June 1st we projected a Major wave 2 low at 1195-1205 for Gold and we bottomed at 1201.  The rally to 1377 spot was Wave 1 of 3 and then Wave 2 bottomed at 1310 this past week. We could see a super surge up in Gold near term as we are possibly in a bullish “wave 3 of 3” right now from 1310.  Two charts are presented below both the long term and intermediate views:  We put out a 1460 target back on June 1st, and that is still on track

713 srp lt gold

731 srp gold

Biotech also has been moving:  

We projected a rally in the XBI ETF about two weeks ago to our SRP members to go from 56 to 63, and so far that has been on track.  Institutions are seeing values in the space after a long Wave 2 down and sideways grind.  (We had pointed out a 7 wave rooftop grinding pattern several weeks ago. We still would like to see IBB over 294 to confirm new Bull cycle.)

731 srp xbi

Oil has been tough:  

Watch 43.18 and 44.81 as resistance rally targets

This is one of the hardest areas to forecast due to inventory reports being volatile and the comings and goings of refiners stocking and drawing down, plus drilling etc. However, our best projection is this is a Wave 4 bump up here from sub 41 this past week and a rally may be short lived. There could be one more down leg to finish this correction from 51.67

731 srp oil

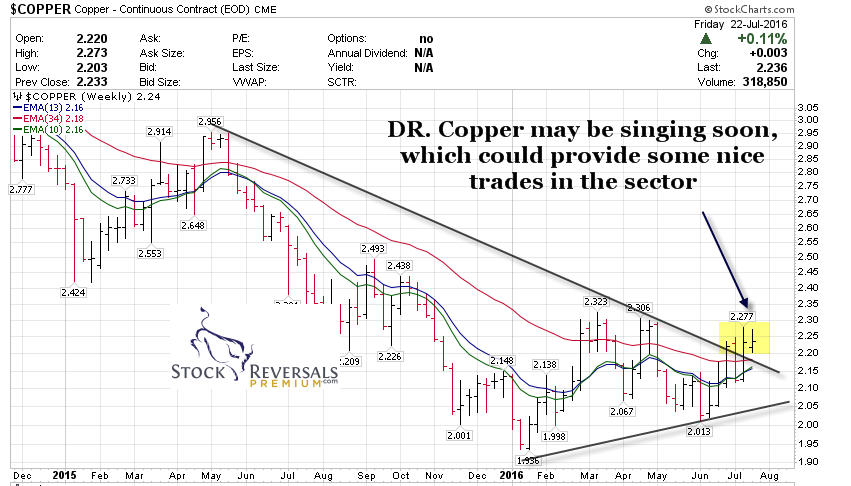
COPPER ready to roll?

Finally the last man standing near the bottom and trying to get up and run is Copper.  We have speculated Copper may be close to breaking out a few weeks ago.  Near term the ball is in Dr. Coppers court, but if this pattern runs to the upside you could see some nice moves in small cap copper stocks and others:  $2.18 is key support 

731 srp copper

Everyone is a genius in a Bull market, so make sure you are staying disciplined and taking your profits on flare ups. Our belief is we are best of as Swing Traders in any market cycle, and we liken swing trades to burning matches.  When a stock or ETF is flaring up like a match, we are booking profits on usually 1/2 the position and then trying to ride the remainder for more gains later on. We had some nice flareups in VUZI and NERV recently at SRP which we took gains on, as well as LABU ETF just to mention a few.  Our last 6  closed out trade positions were gains of 8%, 13%, 13% 16% and 18% on various tranches of trades from entry points.  We dont quibble usually over whether a stock we sold may go higher, we are on to the next low risk high return set up. This books cash into the portfolio and banks gains while reducing risk along the way.  Its how we beat the markets in all cycles and every quarter consistently. Once you start thinking you are a genius and smarter than the market, thats when you go off  the rails. Stick with the discipline, learn from mistakes, but dont blow up your account getting cute.

Our last 5 closed out positions at SRP: Several positions open now with paper gains

7/27- Sold Final 1/2 VUZI for 8% Gains on 1/2 Position Size (5% Equivalent)

7/26- Sold Final 1/2 LABU ETF for 16% Gains on Full Position

7/26- Sold Final 1/2 NERV for 15% Gains on Full Position

7/25- Sold 1/2 VUZI for 18% Gains on 1/2 Position Size (5% equivalent)

7/21- Sold 1/2 LABU for 13% Gains on Full Position

This brings us to our Weekly Forecast section of Swing Trade ideas. These are a small list of ideas for futher review. Stocks with nice base patterns and good fundamentals both. At SRP we focus big time on share structure, price to sales ratios, earnings, catalysts, management and more… not just the chart.  If all you do is trade charts, your going to wake up one morning with a smack in the face loss. We like to assume that even if we stop out of a swing trade for a loss, that the fundamentals are probably going to emerge and turn that loss into a gain later on in case anyone got stuck in the trade. Recent samples being EW, ETSY, YIN just naming a few.

Stock Ideas:

LGIH- Many weeks on the list, ascending base pattern.  Builds entry level homes in high growth areas, PE Ratio 13 strong growth.

AHS- $42.30- Pullback may offer better entry here during this 4 week base. Permanent and Temporary Staffing for Physicians and Nurses etc.

MXL- Chip maker with strong annual growth in an ascending 4 week base. Has been on our lsit off and on for weeks.

GRUB-  Big move up in earnings for Grubhub this past week, a nice pullback to 34-35 would be a good entry from this $37.92 area, may or may not happen.

SIMO- 4 week base pattern for this Taiwanese designer of Microcontrollers and other chip related products.

MBLY-  Mobile Eye already reported strong earnings and then a notice of no longer working with Tesla. Stock dropped but rallied back up from 40 to 48 area. Has a gap at 45.33 if it fills would be better entry area

PLNT- Planet Fitness is in a tight 3 week base. 7.3 million members pay about $10 a month in 47 states to stay in shape.

FB- Broke out on strong earnings and pulled back post earnings but still riding above weekly trend lines. Could be good entry here at 122-124 ranges for longer term investors.

Other quick ideas:  KRA, LMNX, NTGR, RP, STLD all leaders in nice bases.

Weekly Forecast Report SP 500 Gold Oil Biotech and More

If you are not yet an SRP Premium Member consider reading up and joining up at www.stockreversalspremium.com  For just $99 you can start your SRP membership today! We just completed our 2nd quarter track record with 20 winners and only 5 losers. See our Track Record Tab at our website for full details.

If you are not ready to make the leap to our Daily Swing Trading and Forecast service, Opt-In Free today for forecast updates and interim ideas in our Free Service here: OPT IN HERE Just need name and email, we will not share with anyone ever. 


This week in the SRP Forecast Report from The Market Analysts Group:
  • Markets in bullish “3rd of a 3rd Wave” pattern
  • Biotech setting up?
  • Playing 3x leverage off behavioral patterns for big swing gains
  • Oil in trouble?
  • Gold in pullback, what to watch
  • Copper could move soon?
  • The VUZI Pop set up
  • Swing Trade ideas

Back on July 4th we projected a rally to 2176 all time highs, and prior to that on May 9th we projected all time highs to 2160.  We have seen both targets hit in July which is a seasonably strong period for the markets.  We also projected a low for Gold at 1195-1205 back in late May and early June with 1440-1460 targets.  This week we update SP 500, Gold, Oil, Biotech and more in the Weekly Forecast Report:

SP 500- Major 3 and 3rd of a 3rd

Hitting all time highs at 2176 this past week, the SP 500 is in Major wave 3 up from 1810 Primary Wave 4 lows in February.  Brexit caused a final C wave pullback to 1991 and we had projected support at 2002 the prior weekend pre-collapse.  We closed at a closing low of 2000 that week and have been heading higher since.  Major Wave 3 is made up of 5 full waves from 1991.  We are in Wave 3 of 3. These are considered the most bullish in Elliott Wave Theory, and its why you have seen very little in the way of any pullbacks lately.  We have a 2191 pivot upon us, but potentially targets go quite a bit higher ahead:

Below we have  Weekly view and a Daily view with those Wave 3 labels clear…

724 srp sp500 weekly

724 srp sp500 daily

To further emphasize that we are in a bullish Wave 3 in the markets, we can look at thePercentage of NYSE stocks over their 50 day moving average line. This chart below shows a 90% reading peak at Major wave 1 highs, a 29% low at Major 2 lows, and now as part of Major 3 we are back at 80%

724 srp nya 50r

Using Behavioral Patterns to hit 11-13% gains in a few days on LABU ETF

Biotech Update: XBI ETF sets up LABU ETF for fat gains

Human behavioral patterns are a foundation of our work at SRP. We focus almost exclusively on swing trades looking for sectors that are consolidating or bottoming out and then pushing money into them via ETF or Individual stocks at key inflection points.  This past week we did that for example with Biotech.  The sector has been under pressure but also consolidating sideways for a few  months in a running triangle pattern we have pointed out in weekly reports many times.  This past week we saw what looked liked an emerging breakout of that pattern.

We used the XBI ETF to set up a LABU 3x Leveraged ETF swing trade for SRP members. Our theory was XBI was about to turn up in a minor wave 3 to the upside, and therefore LABU would capture the leverage at 3 to 1.  We were right at XBI pulled back right after our alert and we advised SRP members to add more LABU from 30-32, the bottom was 31.40.  We hit 37 plus during the week and as of Fridays close we had sold 1/2 our position for 11-13% gains and held 1/2 long. XBI can climb quite a bit higher which will push LABU way up if we are right.

Note in the weekly XBI ETF chart below how the 10 week EMA Line held nicely for minor wave 2

724 srp xbi weekly

Gold Update: 1440 still on tap, but first wave 2 corrects

We played the NUGT ETF weeks back for 25-30% gains in a few days around the Brexit Vote window, again another example of using Human Behavioral Patterns to extract swing trade gains from the markets.

We advised back in late May and early June that Gold was likely bottoming in an irregular ABC fashion from the 1287 prior highs. We felt that bottom would come in at 1195-1205 area on Spot Gold pricing. Gold bottomed at 1201 and then soared to 1360 before correcting, then testing the 1360 plus area again recently.  We still have our 1440-1460 Gold target we laid out on June 1st intact, and right now Gold is in a minor wave 2 pullback, so far a 38% Fibonacci retracement test at 1310 spot this past week. If that falls then 1270 may be on tap, but for now we think it may get some legs soon:

724 srp gold weekly

Oil Update: 44 area is key

Everyone is trying to figure out what is going on with Oil. There have been some volatile inventory reports and the current thinking is the refiners loaded up on Oil so they could refine and capture margins as oil was rising, but they overstocked. Now that is getting worked off a bit.  We had projected a C wave high at $52 months back and we hit 51.67. At that point we told SRP members and forecast readers to look for 45 to 47.80 for a D wave pullback.  Well, we have fallen below $45 a few times so Oil is on the ropes near term. See our chart below… some oil stocks are looking tempting but we are avoiding for now until we see a confirmed new uptrend.

Keep an eye on that 44.08 pricing which is the 34 week EMA line

724 srp oil weekly

To recap:

  • Biotech may be re-emerging and at SRP we have 3 positions open in this area right now, all profitable.
  • Oil needs to hold 44 area or 42 may be on deck, avoiding sector for now waiting for uptrend to confirm anew
  • Gold is in a minor 2 pullback, if 1310 holds it could get on a run again, intermediate target 1440-1460. If 1310 falls watch for 1270.
  • SP 500 should head to 2191 resistance soon
  • Copper still in base trying to break north but not confirmed
  • Markets are in a Bullish wave 3 of 3 pattern

Swing Trade Ideas: The VUZI POP and how we front ran it at SRP

Speaking of Behavioral Patterns, SRP members were alerted to get long VUZI on July 19th and adding in the 6.75-7.25 areas on dips. We dipped nicely to 7.22 area and then on Friday VUZI exploded upwards on massive volume and an 11% move. Now they are subject of a James Altucher write up and also Investors Business Daily mention this weekend. How did we know to get long prior to this big crowd pattern?  The 13 day consolidation, one of our favorites at SRP…. see below chart:

If you are not yet an SRP Member read up at www.stockreversalspremium.com

724 srp vuzi daily

Below is a list of stocks worth further review and frankly during a 3rd of a 3rd alot of stocks are worth review:

LGIH- On our list multiple times in the 30-31 area, now 34.82 and consolidating gains. Entry level single family home builder.

OLED- LED device designer for Flat Panel Display sector. 9 week base, Earnings due 8/4

MXL- On our list multiple times at $21.10 nearing a big breakout. Earnings due 8/8 on this RF, Analog, and Mixed Signal ICS manufacturer. PE ratio 14 with very strong growth of late

PLAY- Dave and Busters operates 81 restaurants in 30 states with eat, play , drink and watch. 7 week base with earnings due 8/6

MBLY- Mobile Eye is right in the middle of a major Automotive trend of driverless cars with driver assistance systems. 4 week ascending base pattern, earnings due Tuesday this week

IGT- International Game Technology emerging from 3.5 month wide base pattern. Broke out this past week on rising volume. PE ratio only 10 with 30% recent growth. Makes computerized gaming machines for casinos, but one might extrapolate they begin diversifying into Virtual Reality and more.

IIIN- Insteel benefiting from US restrictions on imported Steel

AMBA-  Re-emerging after a bear cycle from 129 highs to 30’s.  Could break north to the 60’s. Provider of chips for video and camera, GoPro and other emerging areas like Drones etc.

These are just a few of many ideas, best of luck with your trading ahead

Copper Update:

Copper may possible emerge from a long term Bear Cycle but this is not yet confirmed. However, worth watching as some big upside plays could emerge from this beat down sector if Copper can break to the upside out of this base we show below:

724 srp copper weekly

Weekly SP 500 Gold Oil and More Forecast Report

If you are not yet an SRP Premium Member, consider just the following metrics:   Read more at www.stockreversalspremium.com  For just $99 you can start your SRP membership today!

If you are not ready to make the leap to our Swing Trade and Forecast service, Opt-In Free today for forecast updates and interim ideas in our Free Service here: OPT IN HERE Just need name and email, we will not share with anyone ever. 

Most recent 5 weeks of All Closed Swing Trades into end of Quarter for SRP Members:

A full position is a 10% allocation and 1/2 Position is a 5% allocation

7/1- Sold 1/2 CLF for 14% Gains on Full Position (3 days on back half we added)

6/29- Sold 1/2 LABU for 14% Gains on Full Position (1 Day)

6/29- Sold 1/2 LABU for 12% Gains on Full Position (1 day)

6/24- Stopped out EW for 4% Loss (Brexit day)

6/24- Stopped out WYNN for 7% Loss (Brexit Day)

6/24- Sold NUGT 1/2 Position for 34% Gains (Original 1/2 position only 5%)

6/22- Sold 1/2 NERV for 10-12% Gains on Full Position

6/10- Sold UBNT for 5% Average Gains on Full Position

6/10- Sold FMC for 4-5% Gains on Full Position

5/31- Sold Final 1/2 CLF for 35% Gains on Full Position @$4.10

5/26- Sold Final 1/2 WLL for 18-20% Gains on Full Position

5/26- Sold 1/2 CLL for 12% Gains on Full Position

5/25- Sold 1/2 WLL for 8.5% Gains on Full Position


We first projected all time highs for the SP 500 back in early May in our forecasts looking for 2160…

Though there have been ups and downs since that time, we stayed the course. The only changes we made were the initial low end pivot projections, but all of them (2160, 2145, 2176) were all time highs.  In our most recent weekly forecast on July 4th we projected a Wave 3 rally from 1991 was underway, and that would require all time highs with a 2176 initial pivot projection.

This past week we hit 2129 to close at all time closing highs for the SP 500.  We will be clear that this 2176 level is our low end projection and would only be a low end wave 3 from 1991 wave 2 low after Brexit bottom.

  • Primary wave 5 is made up of 5 major waves.
  • Major 1 1810-2111
  • Major 2 2111- 1991 (ABC Irregular pattern)
  • Major 3 1991- 2129 so far with 2176 our LOW END projection
  • Then Major 4 corrects 3 and then Major 5 completes the rally from 1810

This week we plan to look back and then look forward a bit on SP 500 and Gold: Lets look at some older charts we did and then update them again:

Here is our May 29th Weekly Forecast report chart. At  the time it looked like the 2111 pivot was Wave 3 up from 1810. Then we had the ABC for Major  4, then 1 of Major 5 was underway. You will see we projected 2160 back then.  What changed is the pattern post Brexit caused a massive disruptive drop to 1991, thereby changing the count a bit, but not the all time highs projection:

530 srp sp500

Last week in our Weekly report, we updated our views to below: Here you can see we changed the pattern to Major 1 at 2111, Major 2 at 1991 (ABC Pattern) and then 3 beginning from there with a noted 2145-2176 initial projection. That is working out well:

74 srp sp500

That brings us to the Weekly Report chart for July 10th: We are in wave 3 of 3 of 5 from 1991 om daily charts and Major 3 from 1991 on the weekly.

710 srp sp500 weekly

710 srp sp500 daily

SP 500 Bottom Line: All time highs are now official on a closing basis, and 2176 is our intermediate target for this Major 3 up from 1991, that is a low end target.

GOLD UPDATES:

Gold has continued to consolidate recent gains after we projected Wave 2 low in late May, early June. Our target was laid out for 1460 on the low end for Major wave 3 up in Gold off the 1045 Bear Cycle Lows.

Here was our June 5th Forecast report Gold chart showing Gold likely in Wave 3 up, and at the time we were at 1246 spot:

65 srp gold

Here is our updated July 10th Gold Chart showing again Wave 3 still underway from 1201: Continuing Major Wave 3 from 1045 Bear cycle lows.  Gold benefits greatly from NIRP Policies around the world, Fiat currencies are not attractive.

  • Major 1 1045-1306
  • Major 2 1306-1201 ABC Irregular
  • Major 3 1201- 1460 minimal projection

710 srp gold

OIL UPDATES:

Finally, that brings us to Oil:  We have been calling for a Wave D correction after the initial ABC projetion we made for $52 a barrel when Oil was back at $29.  We hit $51.67 and have been in a varying degree of correction ever since. Our targets for D which we laid out many weeks ago were 47.80 and or 45 on the low end.  This past week it looked like Oil was going to break out past 50 soon and get the E wave rally underway. Then we got hit with a poor inventory report and Oil  got slammed. That creates uncertainty in the patterns and we will be the first to admit the projecting Oil is much harder than the SP 500 and Gold.

Here was our Oil chart from June 10th showing possible pivot for D near $45, so that is where we sit now 4 weeks later:

612 srp oil

Here is the Updated July 10th Oil Chart:

710  srp oil

Last week was a vacation week and now we are back underway with Active Swing Trades. SRP closed out the 2nd quarter with a flurry of positive trades and we look forward to an exciting 3rd quarter of action ahead.  We will have our full 2nd quarter track record updated online early this week in our Track Record tab with all closed out trades graphed out and noted.


Summary:

  • SP 500 should be attacking the 2176 pivot zone ahead as part of a 3rd wave up from 1991
  • Oil is in a tough $45 test area, we would like to see this hold for our ABCDE pattern to continue
  • Gold remains in a bull market and 1460 is our intermediate target


Weekly Forecast SP 500 Gold Oil Biotech and More!

This past trading week we entered LABU 3x long Biotech ETF for a nice 14%-16% 24 hour gain, we ended the week taking 14% profits on a CLF swing as well. The week prior 25-30% gains on NUGT 3x Long Gold Stocks ETF in 48 hours.  Consider joining us for this type of forward-looking advice, morning updates daily on all positions and markets, Gold, Oil etc and strategy reports, plus swing trades via SMS Text and Email/Post alert with entry, exit, and ongoing advice. Read up at www.stockreversalspremium.com and join subscribers from 40 countries and growing!

Not ready to consider the leap to our Premium Service but like Forecasts and Ideas? Opt In Free for our StockReverals free membership and recieve 2-3 updates via Email per week. We do not share your  email with any other entity ever.  Sign Up here with Name and Email only… click section below to go right to sign up page.

ALL TIME HIGHS STILL AHEAD?

  • GOLD AND SILVER BULLISH
  •  OIL CLOSE TO E WAVE BREAKOUT
  •  BIOTECH RESISTANCE TEST AHEAD AND MORE

Obviously a wild ride this past week post  Brexit vote. Last Sunday we admitted in our weekly report that nobody in their right mind could probably predict the near term movements in the stock market, but we would do our best.  We projected a 2002 low for the SP 500 to contain the damage post Brexit, and we ended up closing at 2000 on Monday.  Then to our SRP members and in some areas online we projected a rally possibly as high as the 2060 area, and as we saw that rally carried all the way to 2109 up 118 points from the lows of post Brexit trading.

What was great is the volatility and our Elliott Wave based models helped us to some fat swing gains. These came with the Gold rally which we forecasted the Wednesday before Brexit, and we levered a trade in NUGT ETF to gain 25-30% in 48 hours for our SRP members.  We followed that up with a swing gain of 14% roughly in LABU ETF, which was based on our short term Biotech bottom call at 241 on the IBB ETF.  Then late in the week we added to our CLF position just in time to wrack up a 14% move within 24 hours later to cap off a great swing trade week at SRP. Probably will be tough to duplicate that again, but  with our forecast model methodology we can often gain that type of traction before new breakout patterns become evident in beat down areas or stocks.

The one thing we didn’t change this past week was our forecast for all time highs, but certainly the path got disrupted.  With 2002 holding, we felt that would be a shallow enough correction from the 2113 highs leading to the Brexit vote that it would not inflict a ton of damage on long term bull charts.

What we have done this weekend is take another look at a possible outcome which is still all time highs, but the next pivot changing to 2176, 31 points higher than our 2145 target we have been using for 3 weeks or so.  Here is a possible outlook for the market action ahead, understanding that after 118 points we need a pullback as well:  Lets see how things play out post July 4th holiday for starters.

74 srp sp500

One of the keys to this continuing all time highs forecast we made on or around May 8th is Oil.  We have had Oil in a bull cycle since we called for a low at $29 (it then dropped to 26.xx).  After the pivot at 35, we said Oil could run to $52 before correcting.  When Oil hit 51.67 we labeled that a C wave high where A was equal to C in length (26 to 42 and 35-52).  Then we looked for a D wave which we thought would go as low as 45, and it hit just under 46.  Now if this Oil rally from there can confirm an E wave we have had targets of 55-62.  If that is right, that will help sustain the all time highs SP 500 projection:

74 srp oil

Copper also is worth watching as that can finally signal growth re-establishing itself and could help confirm the Commodity rally as well.  Below is a chart to watch:

74 srp copper

Gold has been one of our more bullish targeted areas we have been forecasting aggressively for higher numbers.  Our most recent intermediate target was 1460 which we laid out in early June.  This would be a LOW END wave 3 target off the 1202 ABC correction pattern we identified in late May. Gold is money, and with Negative Interest rates in many parts of the world, it makes Gold extremely attractive as an alternative to paper currencies (Fiat money).

74 srp gold

Silver is obviously poor man’s gold. The Gold to Silver ratio was out of whack and now Silver is playing catch up, having risen 11% this past week.  We see Silver as likely having a short term pullback fairly soon, with 5 waves looking near complete. Obviously Silver could continue to run well past this $20 per ounce figure in our chart, but odds would favor a pullback even if shallow near term.

74 srp silver

Finally, we have covered the Biotech sector frequently and recently as of last Sundays report we were looking for 241 to form a low on the IBB ETF.  We hit 241 on Monday, then rallied to 262 on the Friday close, a nice bounce but in keeping with our “rooftop” correction pattern we have been outlining.  This has formed 7 waves so far, and often these will change character after 7, 9 or 11 waves. We would need to see a close over 290 on this ETF before we  could confirm this pattern is turning longer term bullish: Having expected a 6th wave low this past week we banked 14% gains on LABU ETF, though it actually went on to much higher levels from that after we sold by end of week.

74 srp ibb

In the recent past we discussed the percentage of NASDAQ or NYSE stocks over certain moving averages as a helpful confirming top or bottoming indicator.  This past week we saw this level bottom at 25% area and rebound to 50% by the end of Friday’s trading. This is one of our indicators we use to help as an overlay to our wave counts and other metrics we review to keep us on the right side of the tracks.

74 naa 50r

On a side note, the percentage of NYSE stocks over their 200 day moving average bottomed at 52% this past Monday and closed Friday at a healthier 69%.  These are well above the Primary wave 4 lows of just 16% back in February.

Bottom Line? Well its a quick forecast this week due to the Monday 4th of July holiday in the USA.  Also this week we are taking the week off to rest and relax here at SRP, but still wanted to make sure we update the charts and our current views.

  • The market has had a 118 point rally and should pull back some
  • All time highs are still in the cards, 2176 is a new pivot to watch
  • Oil is key to rally continuing and still looks OK
  • Gold and Silver remain in Bull markets, Silver looks a tad extended short term.
  • Biotech has to take out 290 area on the IBB chart to change character of the current 7 wave corrective pattern
  • Markets remain healthy for swing trading

Blog at WordPress.com.

Up ↑