Search

STOCKREVERSALS.COM : Advisors with a Contrarian Bent: Opt In Free for E-mailed Market Forecast Reports, Swing Trade Ideas, & Research

Month

June 2016

Market Crash Ahead? Weekly Forecast

Weekly Forecast SP 500 Gold Oil and More Post Brexit

Late last week SRP Members cashed out of a 2 day swing trade for 25-30% profits in the NUGT ETF. Consider joining us for this type of forward-looking advice, morning updates daily on all positions and markets, Gold, Oil etc and strategy reports, plus swing trades via SMS Text and Email/Post alert with entry, exit, and ongoing advice. Read up at www.stockreversalspremium.com

Not ready to consider the leap to our Premium Service but like Forecasts and Ideas? Opt In Free for our StockReverals free membership and recieve 2-3 updates via Email per week. We do not share your  email with any other entity ever.  Sign Up here with Name and Email only… click section below to go right to sign up page.

sign up

Forecast is for Cloudy skies with chance of Sun later. The Brexit outcome may force us to adjust our intermediate views as well, now that we have new information we didn’t have as of Thursday last week.  One must be willing to adjust their opinion and stay open-minded.  Borrowing a famous phrase… “strong opinions weakly held”. Simply means… stay open-minded to all inputs, but also don’t change your mind every day either.

– Dave, Chief Strategist

We should start of this weekly forecast report by saying that nobody in their right mind can pretend to know the near term movements of the markets following the Brexit vote results this past week. So lets first start by backing up a little bit on our recent views and then bringing that forward to what we are dealing with today in terms of the SP 500 and general markets.

Recently we adjusted our views to a 2145 SP 500 target top off the 2025 “Wave 4” lows.  We outlined a likely ABCDE pattern with 2120 as our recent target after the 2050 pivot.  We hit 2123 on Thursday after the market closed briefly, so our C wave was met.  Then of course Friday we obviously tanked hard around the world which threw our “D” wave pullback pretty deep and much lower than our pattern had suggested.

So here is that ABCDE Forecast for starters prior to Brexit vote: We did this for our SRP members on Tuesday this past week in pre-market. You can see our 2120 C target in yellow:

621 srp sp 500 abcde

We hit the 2113 on the close for C, with 2123 the after hours high.  Check that box off as done. Then regardless of the Brexit outcome we expected a D wave pullback maybe to 2095 or so.  Obviously Friday that got obliterated which put the close at 2037, also below a 2045 pivot point.

That means in our view, we are adjusting the near term outlook to a 2002 pivot support low right now. We believe the market could bottom on Monday based on 3 weeks down in a row which is rare and 13 trading days.  It looks like the Brexit exit caused a change in character obviously for the markets , so we need to adjust our views a bit and then monitor and go from here.  At 2002 it would be a shallow correction of the rally from 1810-2120.

626 srp sp 500

Underneath the indexes we can look at a few market internal clues to help us out as well.  We are now seeing the % of stocks below their 50 day moving average dropping to 43% after this weeks downside and 3 weeks of correction.  This is a fairly low number and means internals are weak, but also getting oversold.  If we zoom out to the % of stocks below the 200 day moving average, we see that number at 61%, correcting from 71%.

626 srp nya200r

626 nya50r

The Market has only had a few instances in the last several years where the SP 500 index was down 3 weeks in a row. In all but one instance the market rebounded very shortly thereafter, so we would look for a washout already upon us and a rebound likely. Keep your eyes on 2002 as the LOW END PIVOT for key support

GOLD RALLY UPDATE

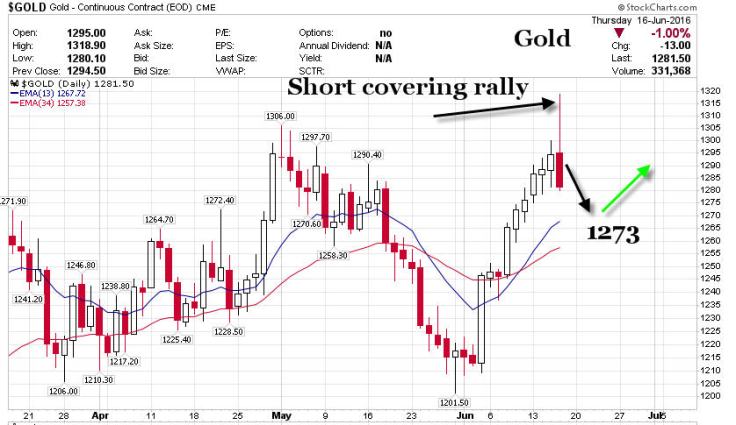
In terms of Gold, we nailed the ABC bottom forecast back in early June, looking for 1195-1206 as a bottom. Gold bottomed at 1201 and then rallied 118 points to 1319 per ounce in US dollars.  Recently a pullback to 1247 put in a near 61% Fibonacci wave 2 retracement ahead of the Brexit vote.

25% Gain in NUGT ETF!!  One member Emailed us with enthusiasm:

Morning, Thanks for the NUGT trade. I got in @ $93 even and sold in the pre-market @ $125.70. Got to love that! Thanks, Doug D. SRP Member 6/25/16

SRP Members were alerted on Wednesday this past week to be bullish on Gold, and we did that viaNUGT ETF which is 3x long the Gold stock sector. Our feeling was no matter the outcome, Gold was bottoming in a Wave 2, and would rally after Brexit vote.  We didnt expect the vote to go the way it did, so Gold rallied alot more than we thought.  This benefited our members to the tune of a 25-30% 48 hour gain in NUGT, which we sold in pre -market and the open on Friday.

Here is our updated Gold view and we came up with $1460 per US ounce as  our intermediate target a few weekends ago:

Wave 1 1045-1288; Wave 2 1288-ABC Irregular to 1201; Wave 3 underway from 1201, 1360 the high so far… 1460 the LOW END target.

626 srp gold

Gold rallied 113 points from 1247 to 1360 overnight at the highs, and that is why we alerted to take those NUGT profits in pre -market on Friday morning. The rally was equal or close to the length of the 1201-1319 rally, indicating a D wave or minor pullback would ensue, which it did on Friday.

OIL UPDATE

Oil is still in a D wave pattern we projected a few weeks back in the forecast report. We felt at 51.67 that Oil had peaked in a C equals A pattern.  The D wave can be tricky, but we projected 47.80 and or 45 as likely bottoms.  So far the low of Oil was around $46.  We expect it to reach 55-57 after this D wave confirms a bottom for an E wave high on the low-end.

626 srp oil

BIOTECH UPDATE:

Finally we update our Biotech views since this is an area we often cover with research. This past week we saw the IBB ETF attempt a rally which then faltered on Brexit news and the market sell off. We had suggested a week or so ago that IBB was still in trouble and would be testing a 255 key support area, which it broke on Friday.  Later in the week we updated a chart on stocktwits showing a sideways running “rooftop” correction pattern. These can go on for 5, 7 , 9, even 11 waves. For now, we are forming another possible pivot bottom with 241 area key: Note the rooftop pattern.

626 srp biotech

Earlier in the week during the market rally we took money off the table at SRP on a Biotech swing play with 10-12% gains. Later that stock gave back all of those gains by end of day Friday and had us back to break even on the initial entry point for the final 1/2. This is why as swing traders we are very big on forcing our SRP members to book profits on the way up, usually by selling 1/2 on the way to our objectives.  The reason is you reduce portfolio risk, raise cash, and bank money while the swing is in your favor.  There is nothing worse than watching a gain turn to a loss.

The bottom line concerns for the markets near term are the effects on fragile European economies and the potential unwinding of trade agreements that may extend past Britain at some point.  The uncertainty will cause further disruption.  The US is heavily insulated against the economy of Britain, but the issue would be any spillover effects or other countries following suit.

Bottom Line?

  • For the near term we would continue to be bullish on Gold due to NIRP policies and currency wars, and we have been bullish on Gold for quite awhile.
  • Oil should correction and likely head back up if 45 holds.
  • SP 500 needs to hold 2002 to keep bull trend or consolidation alive.

We will see what Monday brings, but we think a possible washout low early this week and 2002 again being key to watch.  If markets don’t totally melt down we may see some great opportunities near term.

SP 500 Gold and Oil Forecast Updates

We are sharing the morning pre-market Forecast section from our SRP subscription service. At SRP we provide key SP 500, Gold, and Oil short term to intermediate forecasts. This helps us with our Swing Trade strategies which we alert via Text, Email, and Post to our SRP members a few times per week. Updates every morning on all positions, market strategy and swing trade planning with alerts. Join us today!  Read up at www.stockreversalspremium.com

Not ready to make the leap? Opt IN to our Free StockReversals.com service where we will provide you these types of updates 1-2x per week via Email and password if needed, along with Swing Trade ideas here and there. We never share your information, just need name and email.


MARKET FORECAST  & CHART UPDATES: SP 500, Oil, Gold, Stocks

SP 500 2083 Up 12 Monday Futures up 5 as of 845 am est

SP 500 Market Note: Market may be forming ABCDE Rising Wedge from 2025 lows of Wave 4. See chart. 

Gold: Hitting the 1273 target we laid out late last week for SRP

CHARTS OF THE DAY:  

SP 500 AND GOLD

621 gold 621 srp sp 500 abcde


Market, Oil, and Gold updates:

2085 is near term resistance right now on a closing basis.

A huge rally to 2101 or 30 points later gave way to profit taking and the SP 500 closed up 12 points to 2083.  We had been targeting 2120 for the C wave up in an ABCDE pattern we believe may be now unfolding from the 2025 Wave 4 lows. We may see more volatility until the Brexit Vote on Thursday for sure, including Gold.

Intermediate View:  We are looking for 2145 as a low end target for this move from the 2025 Wave 4 lows. We think this entirety of Wave 5 may line up now as an ABCDE rising wedge pattern perhaps into August before the next major correction.  It appears Wave C up is now underway officially from the 2050 wave 2 lows. Initial target is 2120, so far we hit 2101.

Oil –  49.12 as of this update – $55 possibly ahead

Oil fell to the low 46 area, about $1 above our low end $45 target.  This helped drag the SP 500 index down in a Wave 2 correction.    This recent pullback to around 46 was a D wave correction after our projected C wave high at 51.67.  We had 47.80 and 45 as our pivot D wave targets. In the weekend report we updated targets to 55 possible ahead.

Gold-   $1273 Spot-  Hitting our 1273 target we laid out last week late. May be a buying pivot here… 


Late last week we said to look for 1273 as a possible bottom pivot off the 1318 spike highs.  See Friday’s note below:

Gold rocketed on Thursday to 1318 at the high, most of that shorts having stops all run near the highs and then finally a $37 dollar drop once that buying exhaustion ended. We see 1273 as a possible pivot point here, so far the low around 1278….  Gold remains in a Bull trend and we have an intermediate $1460 target (months out).


Market Forecast Report: SP 500 Gold Oil Biotech and More

Weekly Forecast Report- Correction over?

 We projected a 2145 High for SP 500 back on May 8th, and we are tracking that path every weekend.

Our SRP members get updates every morning in pre-market on Oil, Sp 500, Gold, and more plus our swing trade alerts with full post, details, text, and email. Consider checking us out by reading up at www.stockreversalspremium.com  See why we have beat the SP 500 over 12 to 1 since inception.

Free service opt in:

If you have not yet “OPTED IN” to our free Stockreversals.com alerts, please do so with name and e-mail here.  When you sign up we do not share your information with anyone and we will send you a few emails a week with forecast updates and ideas as they come up. This gives you a chance to sample a little bit of our work and perhaps join our SRP service later.

After a 13 trading rally took the SP 500 from 2025 the bottom of major wave 4 from 2111 per our view, we had to correct.  So far we have had a 7 trading day consolidation period with a low of 2050. This low eclipsed our initial low end projected target of 2062 by 12 points.  Late last week we updated our SRP members that if 2062 did not hold for the SP 500, we may see 2045.  That day 2062 broke on the downside and we bottomed at 2050 and then ripped 27 points to the upside.

With that action now behind us, monday brings the 8th day of consolidation and we are all aware of the Brexit discussions and fears.  We believe these are over done and even an exit would be a 3-4 year process. This reminds us of other bull market bogey men spooks, such as “Tapering”, “Ebola”, “Fiscal Cliff”, “Zika Virus” and whatever else the press can drum up to get ratings. Our view is the headlines of the day are not that important, but social mood and sentiment is.  During a wave 2 or wave 4 correction, depending on the degree of magnitude… whatever the headlines of the day are tend to be interpreted negatively.  During waves 1, 3, and 5 they are interpreted positively.

So right now it seems we are in the midst of a wave 2 down from the 2120 recent highs, and possibly a wave 3 to the upside may be due. In either case, the Brexit vote will come and go and the market will get back to business. 2045 is KEY support for the uptrend in our view.

Here are several charts to attempt to help see our point: No matter how you slice it, the consolidation continues and may lead to a very bullish breakout as long as 2045 holds.

619 srp sp 500 daily 2

619 srp sp500 daily619 srp sp500

Other indicators we like to use at extremes include the Mclellan Oscillator and the NYA percentage of stocks over the 50 day moving average lines.  As we can see below, when the SP 500 completed a 13 day rally to 2111 both were extended, and now they are back to neutral readings. The first chart is from this Friday’s close and the second was from Wednesday’s close last week as sent to SRP members.

619 nya50r615 nymot
OIL: ABC, D, and ?

We also had projected Oil to hit 52 or close back when it was at $39.  When we hit the 51.67 top we called that a “Wave C” with a “Wave D” correction likely to hit 47.80 on the shallow side and as low as 45 on the deeper side.  We dropped near $46 this past week and then rallied. If Oil gets legs, we could see the SP 500 back to 2120 pretty quickly with 2145 our target still intact for all time highs

619 srp oil

We will also point out a slew of growth stocks that were market leaders or are market leaders are building 3-4 week base patterns. This currently is frustrating many a swing trader including us a little as quality names are in pause mode and in 3-5% trading ranges. This is usually when the market will try to wear you out or throw you out.  Try to be patient.

Gold takes the lead

Gold has been the obvious leader of late as the SP 500 and markets have corrected. Back in early June we pointed out a 3-3-5 correction pattern that we said was winding down.  Our target was for a run back to 1292, later 1306 re-test, and down the road 1460.  This past week Gold soared to 1318 as money poured into the GLD ETF and caused more short covering and more GLD buying and more short covering. This finally culminated  with a parabolic high of 1318 and a $37 drop inside of 24 hours.  Gold then recovered late in the week to just over 1300 an ounce.  We are updating the intermediate chart below:

The clear ABC correction ended at 1201 which was  38% Fibonacci retrace of the rally from 1045 to 1288 for Wave 1.  We are now in the early stages of Wave 3 which targets 1460 on the low end over the next many months. First we should see a pullback to 1273 area, below are two charts one from Thursday June 17th and the other is the weekly chart

617 gold

619 srp gold

Finally, the oft watched Biotech index which we warned about a few weeks ago as peaking into the ASCO conference continues to run into resistance at the 34 week EMA line on weekly charts.  Right now a possible sideways running correction may be unfolding. This looks like a series of A frame rooftops, and they can go 5, 7, 9, 11 waves long… that said, a crucial test near 255 on IBB ETF is upon us.

619 srp ibb

Here is an abbreviated list of leading stocks that are in consolidations or base patterns and warrant further review in our opinion:

LGIH- Entry level single family home builder, 11 week base pattern could break north soon

AHS- Permanent and temporary staffing provider for Physicians and Nurses. 7 week base, has been on our list multiple times

MXL-  Strong pullback last week may provide lower risk entry in this communication and video display tech manufacturer. Key support near 18.50. On our list often.

PAYC- Also on our list often, 7 week tight base. Provides cloud based employment life cycle management software for employers and employees. Fast grower.

IGT- Manufacturer of computerized casino gaming  machines and systems. $18 support in multi week base , PE Ratio of 9 with strong growth

Consider joining our SRP service if you are not yet a member.   Swing trades with email, post , and SMS Text alerts for entry, target, and exit. Morning pre market reports with forecast updates on SP 500, Gold , Oil and more.  Daily commentary and updates on all positions and market strategy planning. 24/7 access to our Chief Strategist. Out performed the SP 500 over 12 to 1 since inception

Market Forecast- Pause in Uptrend or Worse?

SRP Market Forecast- Shift in Character or Pause?

SR- Weekend Forecast- Uptrend Pauses and Now What?

Recent comments from our Swing Trading service members at SRP, read up online and learn about our track record and methods of smashing the market (Stockreversalspremium.com)

If your not ready to pull the trigger, then join our Free advisory service with name and E-mail to receive occasional Market and sector updates and forecasts, plus stock ideas via Email. This give you a chance to sample our work prior to joining SRP.

I am a recent member and have to say you guys have been spot on with your macro predictions since I joined.  I am really happy to have found your service and  have enjoyed the fruits of your labor these past few weeks.- SRP Member D. Patel 6/6/16

I am glad I am a subscriber. Your analysis gives me the confidence to invest more aggressively than I would on my own. I have blow away the markets averages for this year. Your analysis increases my odds. Thanks again! SRP Member Nick H. 6/8/16

This weekend we cover the following in our Forecast updates:

  • SP 500 in wave 2 pullback
  • Oil due to correct
  • Gold and Silver back in uptrends with pullback due near term
  • Energy stocks under pressure, WLL sample
  • Commodity index likely to pivot lower -Charts on CLF and CRB
  • Brexit and Bank Stress Tests both on June 23rd

This past week we saw  the SP 500 soar to 2120 highs off the 1810 Primary wave 4 lows, and off the major wave 4 at 2025 we pointed  out recently.  Our target has been 2145-2160 since around May 8th.  However, late in the week we saw a strong pullback after a 13 trading day rally.  During the week we warned our SRP members of a likely pullback after a 13 day rally and on Thursday and Friday we began that pattern to the downside.  We sent a chart out Thursday in pre-market pointing to a downtrend coming, and then on Friday we updated the figures to 2084 and or 2098 as expected pivots.

Recently we saw the Bulls in Investment Advisor surveys soar from only 35%  two weeks ago to 47% as of this past week, another indicator of a short term top in sentiment.

Here is our weekend updated chart looking for a Wave 2 pullback to 2084, possibly 2062… so far 2091 is a hidden pivot between our 2098 and 2084 zone.

We would keep an eye on June 23rd as a possible pivot date as the BREXIT Vote and Bank Stress Tests are both due. We could bottom around that time if not before.

612 srp sp500

Part of the issue was Oil hitting our ABC target top near $52, that requires a pullback to correct that move.  We had projected Oil to hit 52 area way back in early April and when it approached this week we noted that at the 51.67 highs that the C wave was exactly identical in length to the A wave off the 26.xx lows of the Bear cycle.  When you see this type of symmetry usually it means a change in character is about to take shape.  We told our SRP members to look for 47.80 to 45 areas on Oil for a pullback.

As Oil pulls back the market is likely to correct with it, below is our update:

612 srp oil

This Oil top where A equals C would have kept you from chasing up energy stocks late in the rally such as WLL (Whiting Petroleum).  See how this stock tanked from 14.xx as we hit the C wave high in Oil to below 12 and likely heading to low 10’s:

ABCDE Chart may have topped out WLL for awhile, watching for $10.20 area possible:

612 wll

By the same token, we have the Commodity index with a possible short term ABC wave top, with a D wave underway. A few weeks ago in our weekend forecast we talked about CLF maybe benefiting from a 2nd boost in the reflation stocks. Sure enough both WLL and CLF rallied and we had nice swing gains at SRP on both. That said, we didnt catch the very tail end of that CLF rally to 5.44 which ended up as a phenomenal 80% move:

CRB and CLF charts below:  We could see further pullback near term

612 srp crb

612 cll srp

Gold Bottoms: Pullback ahead then 1306 likely challenged

Finally, back in early June we pointed out a 3-3-5 Pattern in Gold that was in the process of bottoming. We had a 1995-1206 zone as most likely for a bottom. We hit 1201 which was the C wave low of this irregular ABC pattern.  So far  Gold has rocketed to about 1281 but near term we should expect a pullback before an attempt to hit the prior 1306 highs of the B wave .

A great entry for Gold would be in the sub $1260 area if we get a pullback. A rally into the Brexit vote and Bank Stress tests on June 23rd could make sense

612 srp gold

Silver also bounced off the bottom channel and we update that pattern below: Target 18.50 after pullback due

612 srp silver

This brings us to some swing trade ideas to consider as the market pulls back ahead:

MXL– Maxlinear- RF, Analog, and Mixed signal IC’s in the semiconductor/chip sector. PE ratio of 13 with strong growth and nice chart

PAYC– Cloud based solutions for the full employment employee life cycle. Strong growth, nice 4 week base

BGS– Shelf stable food products like jellies and hot sauces. PE ratio 25 with recent 71% year over year growth. Breaking out of 6 week uptrending base

CBM- This has been on our list multiple times. Possible break out of 7 week base pattern. Active pharmaceutical ingredients and intermediates used in the manufacture of drug products. PE ratio 20 with strong 70% year over year recent growth, major resitance at $52 area.

EBS– 4 week base in this provider of Vaccines and Therapeutics.

CEVA– 13 week base possible breakout for this Semiconductor manufacturer

AGIO– Possible oversold bounce near $50 on this Biotech that is teamed up with Celgene

GIMO– Close to breaking out of 52 week high base pattern. Helps optimize network infrastructures, PE ratio 38 recent quarterly growth yoy of 69%

USCR- On the list recently several times. 12 week base pattern could break out soon. Reasonable PE ratio near 10 with strong growth in ready mix concrete area for public and private construction.

Best to your trading in the week ahead

Dave, Chief Strategist-Stockreversalspremium.com


Market Forecast All Systems Go!

Forecast Report- SP 500, Gold, Oil and Fresh Ideas

If you are not yet OPTED IN for our Free StockReversals.com service, please do so with name and E-mail today.  We do not share your information with anyone.  We will however send you a few e-mails each week with fresh market forecast updates, sector updates and or stock ideas as they come about.  This gives you a chance to sample a bit of our work before considering our SRP service for those not ready to make the leap.

June 5th Weekend Forecast Edition from Stockreversalspremium.com  our premiere Swing Trading and Forecast service with daily position updates every morning, fresh swing trade alerts via Text, Email and Post with daily guidance and exit advice, and forecasts that keep you ahead of major market pivots.  Read up to learn more.

A 26-30% Gain booked on a 4 day swing trade (CLF) this past Monday, would have paid for years of SRP subscription service!


IN THIS WEEKS FORECAST REPORT:

  • SP 500 HEADING TO ALL TIME HIGHS
  • GOLD IN WAVE 3 TO 1460
  • OIL HEADING TO 52 STILL?
  • CLF SWING TRADE 26% GAIN
  • LIST OF SWING STOCKS THAT APPEAR ATTRACTIVE
  • STOCK VALUE POST IPO BASE IDEA- YIN

This past week saw the SP 500 index end the week flat with the prior weeks close, and now forming a 7 day base pattern.  We may see a change in character as soon as Monday or Tuesday this coming trading week.  Our target we laid out on May 8th has been 2160 for our low-end projection of what we see as a “Wave 5” rally off the 2025 “Wave 4” lows.  We are modifying that to 2145 based on our models, which would be an all time high.  Assuming we hit that, we will then adjust our forecasts and determine whether the entire rally up from 1810 (Our Primary Wave 4 low) is over, or just Intermediate Wave 1 of 5.  In other words, will the SP 500 hit a new all time high and then complete a Primary 5 top for this Bull cycle from 2009 or will be merely correct and then power higher down the road?  One week at a time, but that is what we will be working on going forward.

Chart wise below we can see a classic “Bullish” Reverse Head and Shoulders pattern, and the obvious resistance at 2111.  Below this chart, we show the recent wave counts with Wave 3 topping at 2111 which we projected well in advance, and then 2025 being wave 4, and now wave 5 still underway.

Note this past weeks 20 point pullback is another shallow but classic 23% Fibonacci retracement of 2025 to 2105, so the market remains bullish until it isn’t.  2145 looks good to us…

65 srp sp500 weekly65 srp sp500

We also saw Gold reverse hard to the upside late in the week. Last weekend in our forecast report we projected a 3-3-5 bottoming pattern in Gold was coming to an end.  We updated that again mid-week at SRP for our members as well as on Stocktwits with the chart below, 1 day prior to the explosive upside move on Friday:

Gold rallied past the 1237 resistance zone on Friday as a weak jobs report indicated a possible delay in a Fed rate hike.  We  believe that is all just noise because we projected that the US dollar would peak around 96 a few weeks ago in our weekend forecast report and it hit 95.95 and topped out. This caused Gold to slow down its decline and then on Friday the Dollar tanked and Gold popped on big short covering.

Here was our June 2nd pre market Gold chart this past week that proved prescient:

62 sr gold

Gold to 1460 next??

As you can see, the Elliott Wave pattern we identified is complex (3-3-5) means 3 down, 3 up, 5 down. The top of Wave 1 was 1288 back in February, then a 3-3-5 pattern completed an irregular ABC move.  Note how once again Fibonacci math comes into play as the 1201 low was at the 34 Fibonacci week MA line on weekly chart  below.  The 105 point decline from 1306 B wave high was also a 38% Fibonacci retracement of the bear cycle lows to 1306 B wave top highs as well.  It all lined up nicely for the explosion Friday.

65 srp gold


We could see Gold now begin early stages of a Wave 3 power move and if so, we could be looking at 1460 as our initial high-end target down the line.  We will keep you posted and updated if things change materially to alter that view.

Oil has continued to consolidate and we had projected $52 back when it was trading near $39 many weeks ago. It should take a run at it soon and we also see 57, 60, 67 longer term as possible. We have an ABC rally label for now, the same one we used to come up with $52.  We will modify going forward if price action warrants:

65 srp oil

CLF Swing Trade Sample: 26-31% gains in 4 days

This past week we had a nice Swing trade at SRP in which we sold 1/2 CLF for 10-13% gains, and then coming into Monday we were holding 1/2 long in case of a big upside move we thought may occur from where we sold at 3.49.  Sure enough the stock vaulted higher to 4.25 area early in the week for a 26-31% move for SRP members on the back half of the swing.  Timing is everything as that trade only took about 4 trading days.  CLF could climb much higher in the coming months but with swing trades we stay extremely disciplined and take profits to raise cash and reduce portfolio risk always. Sometimes a stock will continue much higher (like YRD) but in most cases they retrace back and profits not taken would otherwise be lost.

65 srp clf sample

Market Indicators:

We are seeing the Bulls in Investment Advisory surveys now climbing to 45% up from 35% last week, but still well below 5 year highs of 58%. Bears are currently standing at 24%.  Still room for this to move higher in favor of the Bulls, so contrarily still bullish in terms of a reading.

We had 166 new highs and 8 new lows on Friday on the NYSE, strong action.  Many sectors are now participating such as Medical, Tech, Chip Stocks, Retail, and Software. This makes for a healthy market.

Growth stocks are leading Value stocks also, which is a bullish sign for markets.

Small Cap Growth is leading Big Cap Growth on a relative basis the last several weeks which is a good sign. However, lets keep in mind that the Small caps had a dramatic 30% plus drop from their 2015 highs during Primary wave 4. They still have work to do, see the IWM ETF chart below:

65 srp iwm

Bottom Line?

  • Markets remain healthy for swing trading and investing
  • SP 500 should target 2145 and then we will assess from there
  • Gold is possibly in a new up cycle wave 3, with 1460 the intermediate-long term target if so
  • Oil consolidating and should attempt a run at $52 on West Texas Int Crude

This weekend we again have a list of stocks that appear attractive  both on fundamentals and technicals, and worthy of further review:

CBM AHS EW MXL PAYC BUFF UBNT EBS CRTO HTHT IBP PEGA FN SLCA YIN

Stock value of the week spotlight: YIN- POST IPO BASE

YIN went public in the past 5 weeks at $13.50, currently trading at $12.73 a share post IPO.  This has formed a nice ABC base pattern and investors have not been turned onto the stock yet.  They are China’s largest and fastest growing precious metals trading firm.  With the 100 million raise in the IPO they now have a war  chest of 150 million and about $1.50 per share in cash.  If we strip out the cash per share, the company is trading at a PE ratio of about 7-8x our 2016 earnings estimates. In the most recent 1st quarter they reported year over year 70% plus growth and 44 cents per share pre-ipo.  Post IPO we calculate the earnings per share at about 38 cents.  With China likely coming back into favor and Gold in a Bull cycle, this is a stock that we think is fundamentally undervalued. We have been buyers of the stock below 13 and believe fair value is $17-$19.  Reminds us of YRD which we wrote up at $6, its now near $16, but also traded below its IPO for some time before blasting off.

63 yin 5 week base

SP 500 Gold Oil Biotech Forecast Updates

If you are not yet a FREE StockReversals.com member  (Click to Join) please consider “Opting In” via Email and name.  We do not share your information with anyone. We will send you occasional forecast updates as you see below, along with sector and swing trade ideas as they come up. This gives you a chance to sample some of our work and then perhaps consider joining our premium swing trade and educational service at www.stockreversalspremium.com (We have out performed the SP 500 over 12 to 1 since inception). 


MARKET FORECAST & CHART UPDATES: SP 500, Oil, Gold, Biotech IBB

SP 500 2099 up 3 Tuesday, Futures down3 as of 830 am est

SP 500 Market Note: 2160 still on target from May 8th projection

CHARTS OF THE DAY: 

SP 500 OIL GOLD BIOTECH ETF IBB

Market, Oil, and Gold updates:  Fresh money comes in early June from Pensions/401k’s etc.

See fresh SP 500 chart

So far the pullback has been to 2085, we were looking for 2073/74 area as likely, but in any event so far an 18 point pullback is pretty shallow. That said, our focus remains on the 2160 target from our May 8th weekend forecast, the squiggles along the way are not of much consequence right now. When and if we hit 2160 then we need to re-assess where we are in the pattern, but we take everything one day and week at a time at SRP. We do not make it a practice to get ahead of ourselves with forecasts, preferring instead to pick the likely pivots ahead and make sure we are on track in that direction.

Intermediate View: 2160 possible for Major wave 5 from 1810. 2025 should be the confirmed Wave 4 bottom with Wave 5 up underway. Pullback to 2073-74 area likely soon, so far 2085 is the low pullback point.

Oil –  $48.71 WTIC. Oil is in day 11 or Day 12 of a consolidation, so still good shot at a run to 52 area after 1-2 more days- See Chart

We had a 52 target out a few months ago when Oil was 35 area, so approaching soon. That is where A equals C in terms of the rally. Its possible longer term to see 55, 60, 67 going forward but major resistance at 52 expected.  

Gold-   $1215 spot. May be in a 4th wave up now with wave 5 to test 1201 or 1193-95… or we bottomed at 1201. Will know if we get past 1237 I think. Longer term resistance 1257. See today’s chart

We said 1195-1206 range for a bottom. The weekend report lays out our 3-3-5 pattern we project for a near term low.

Below our the charts we shared with our SRP members this morning on Biotech, Oil, Gold, and the SP 500.  We had projected 2160 for the SP 500 back in May 8th, Oil to see $52 back when it was $39, and Gold recently to likely bottom between 1193-1201. Biotech is also not out of the woods just yet… 

62 srp ibb 62 sr gold 62 srp oil 62 srp sp500

Blog at WordPress.com.

Up ↑